Posted on behalf of Prof Derrick Moot
The recent rain has done little to top up the soils on dryland farms in the Canterbury region or fill the hydro Lakes. To understand the situation I asked Dr Black to send me the latest soil water data from the RADE. This is a typical soil (Templeton) for many dryland sheep and beef farms in Canterbury. It holds about 300 mm of water. In most years we would expect winter rainfall to recharge the full profile but at the moment there is a deficit of about 166 mm. Based on a typical pasture water use efficiency of 20 kg DM/mm of plant available water that means at least 3200 kg DM/ha less feed will be grown this spring than normal – unless we get another 150+mm of rainfall in August and September. After that evapotranspiration will exceed rainfall in October so the soil will dry.
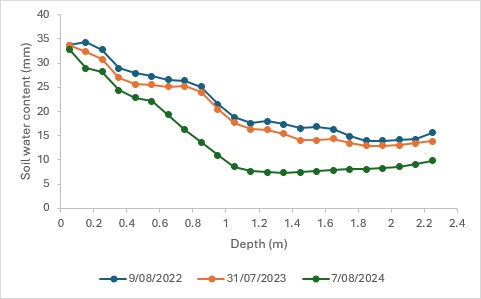
We know things are dry because of the routine soil moisture measurements taken in the RADE experiment. The figure below shows the current average soil water profile for 16 plots compared with the previous two years. Assuming the 2022 and 2023 years had full soil water profiles – because they are virtually identical – and they were La Niña years we can use them as an estimate of the drained upper limit or field capacity. Over last summer (2023/24) the soil water was gradually used – ending in the green line. Soil water is used from the top down – so last season’s dry conditions put maximum demand on the soil and the profile was dried out – especially in the layers below 0.8 m. There the green line can be used to estimate the lower limit or wilting point. The difference between the green line and the other two indicates the current deficit.
Once rainfall exceeds evapotranspiration in autumn/winter the profile fills up from the top. This year only the top layer 0.1 m has recharged to its drained upper limit. All of the layers below this have not recharged fully and there are only signs of any water being available to 0.3 m. In Figure 1 (below) this the green line deviates markedly from the others and shows the soil is dry. There is certainly no drainage occurring and thus no nitrate leaching from this profile. The bottom layers from 1.0 to 2.3 m only hold about 16 mm water per 10 cm soil layer (blue and orange lines) and when dry that value is about 8 mm/layer (green line) which is consistent with them being stony or sand layers. The deep roots extracted moisture from these last summer but they certainly haven’t been recharged.
So what to do? Hoping for rain is not a strategy. Here, we have decided to retain the annual ryegrass pastures that have been grazed recently and allow them to regrow with the moisture available in the profile now. With average spring rain of 50 mm per month they should give us two more grazing opportunities before the end of November when they can be sprayed out and fallowed from Dec-Feb before resowing – depending on rainfall – with annual ryegrass or cereals next March/April. Our pastures have a high legume content so are not N deficient and, thus, an N application is unlikely to give a response . However, on N deficient grass dominant pastures a 50 kg N/ha application within the last two weeks (or this week) would be helpful. Lambing cover needs to be 1500-1600 kg DM/ha to maximise ewe lactation and lamb growth rates – too many farmers lamb on covers of <1200 kg DM/ha. So, like all of dryland east coast regions, we will be watching the forecast for rain and importantly measuring what is happening to the soil moisture to inform animal management decisions through the spring and summer.