The MaxClover experiment ran from 2002 to 2011. A photo diary is now available for viewing/download (117 pp; PDF 18.3 MB). This diary documents the changes in pasture composition over time. A written commentary is included to describe the changes observed. Additionally, a full list of scientific publications, with links where available, is listed at the bottom of the page.
The ‘MaxClover’ Grazing Experiment was established at Lincoln University in autumn 2002. This long-term replicated experiment ran for 10 years and allowed dry matter and sheep liveweight production to be measured for nine full growth seasons.
Supplementary Material | People | Scientific papers | Downloads
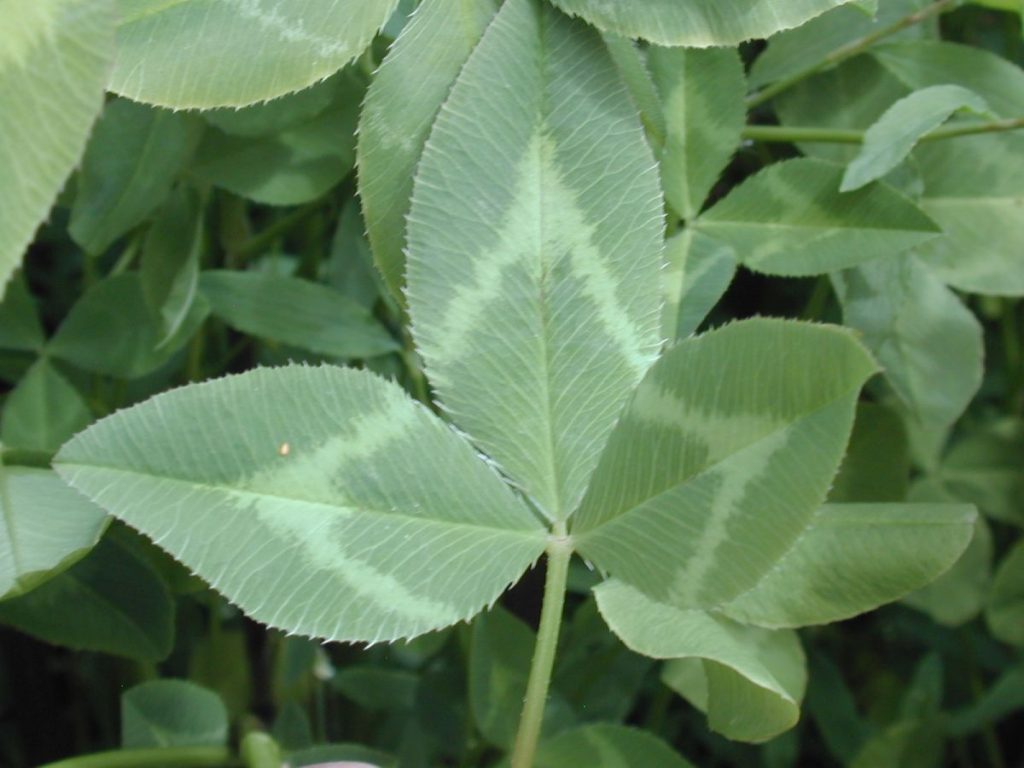
Caucasian clover leaf 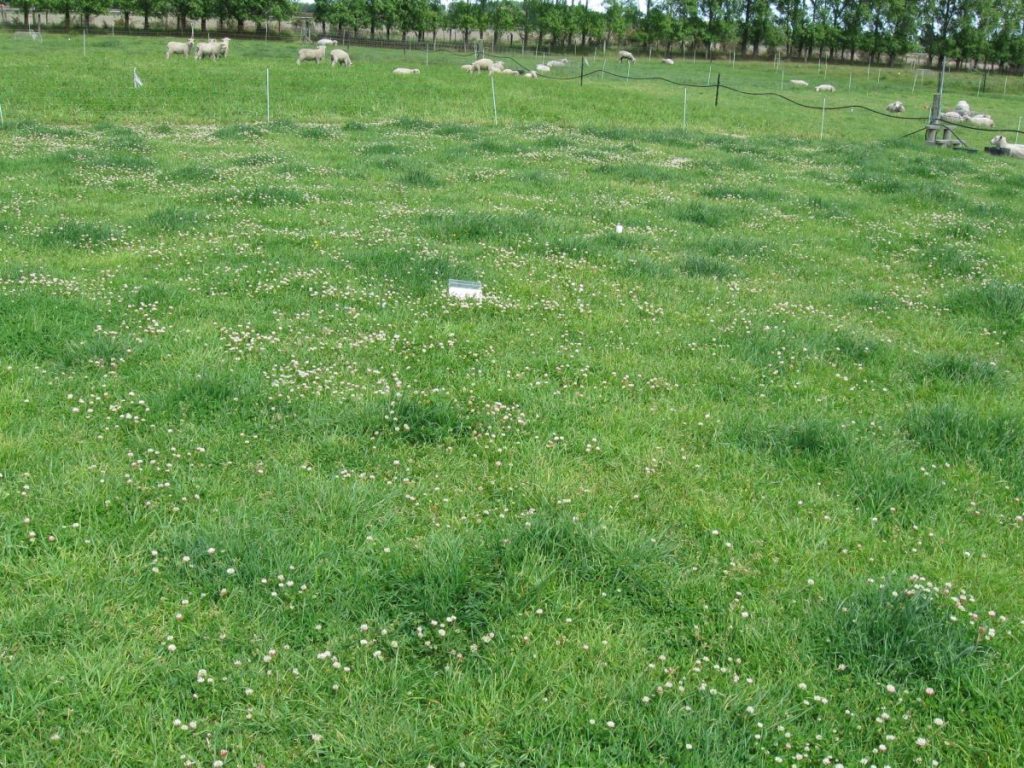
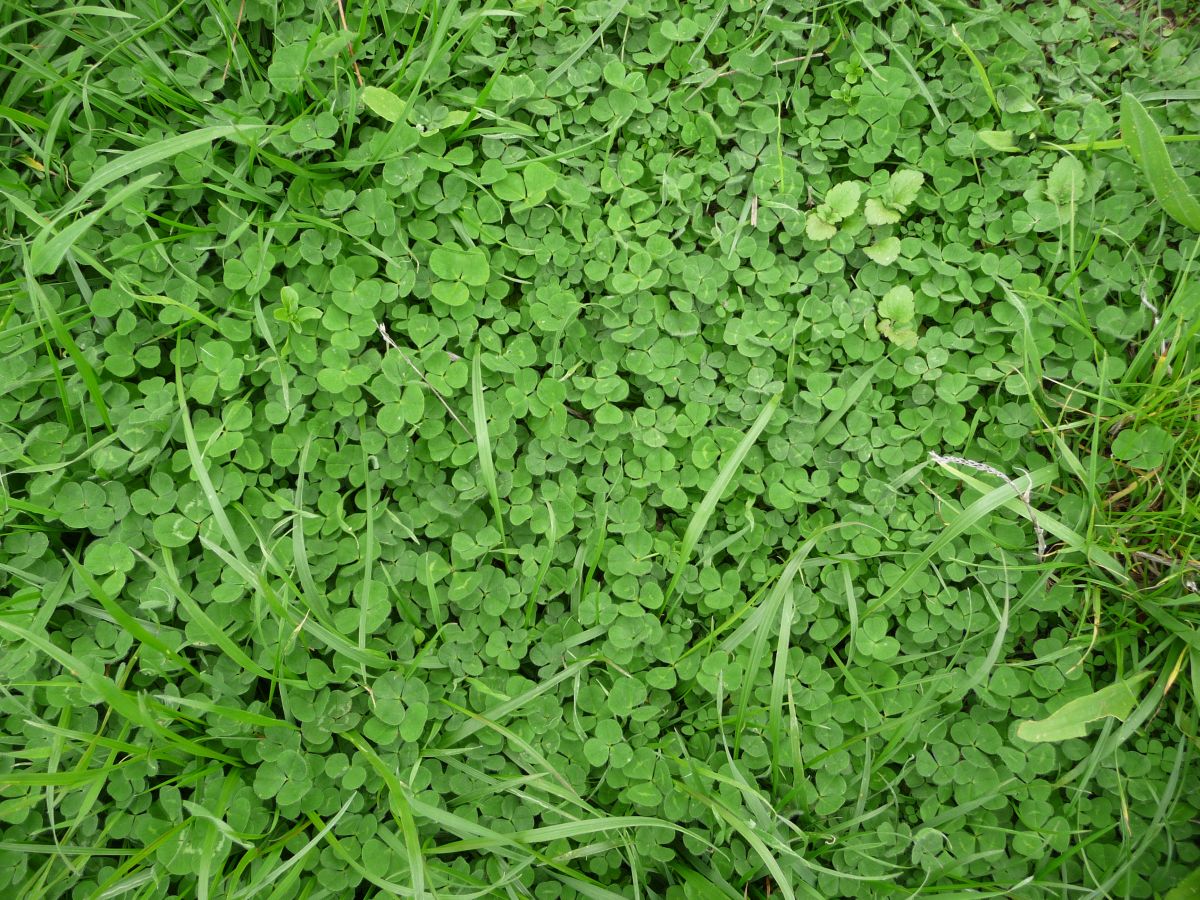
Clover based pasture 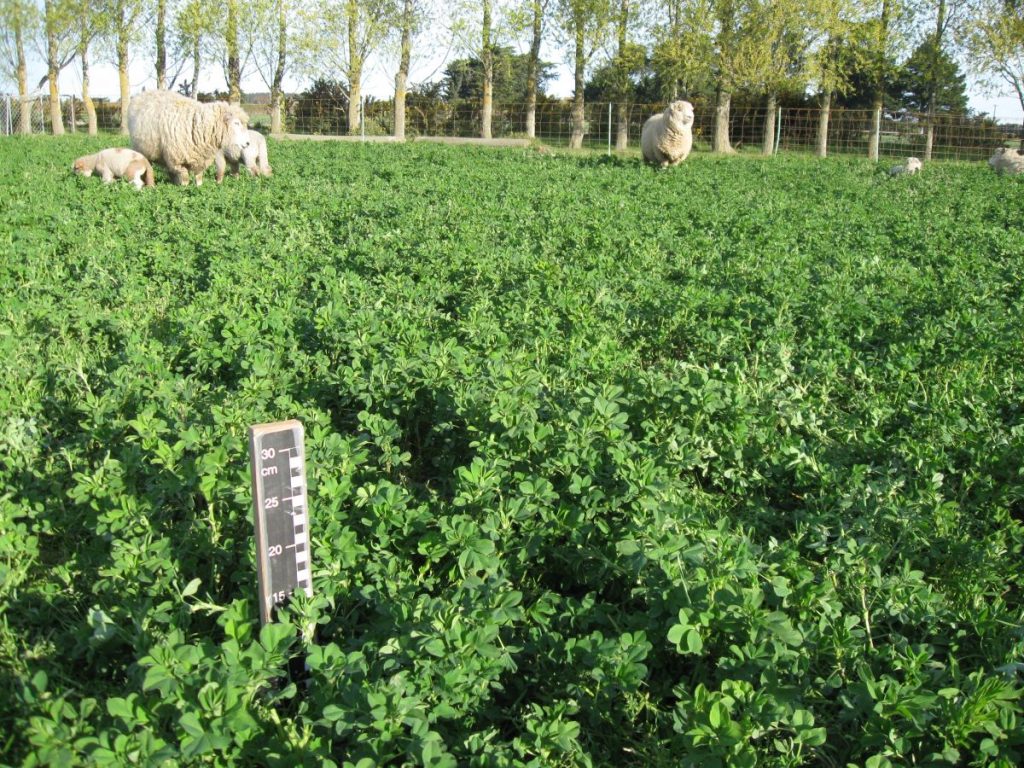
Direct grazing lucerne 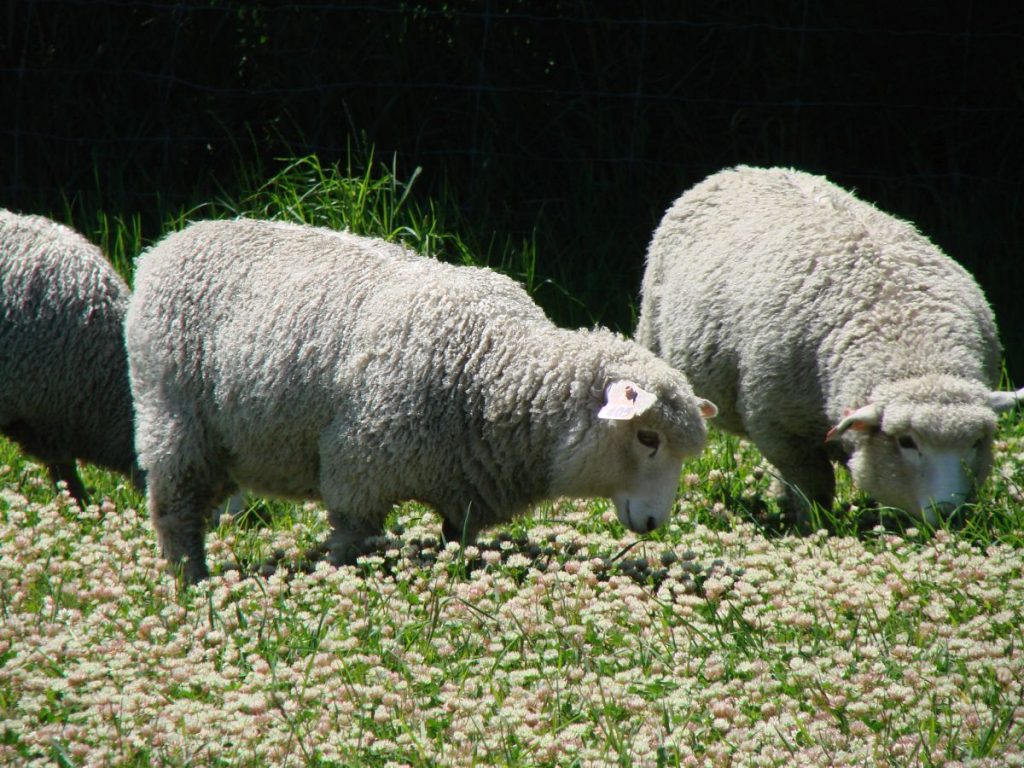
Weaned lambs on balansa clover dominant pasture
There were six different pastures evaluated with one of the main aims being to identify a legume which could complete and survive within cocksfoot (orchardgrass) based pastures in dryland environments which experienced periodic water stress. Four of the pastures were cocksfoot (CF) based sown in a mix with either subterranean (CF/Sub), balansa (CF/Bal), white (CF/Wc) or Caucasian (CF/Cc) clovers. The Sub and balansa clovers were annuals and the white and Caucasian clovers were perennials which allowed the Lincoln University Dryland Research team to look at how resource demand could be offset within a mixture to reduce competition between the grass and clover for water, light and nutrients. These cocksfoot based pastures were compared with a perennial ryegrass/white clover control (RG/Wc) and a lucerne (Luc) monoculture.
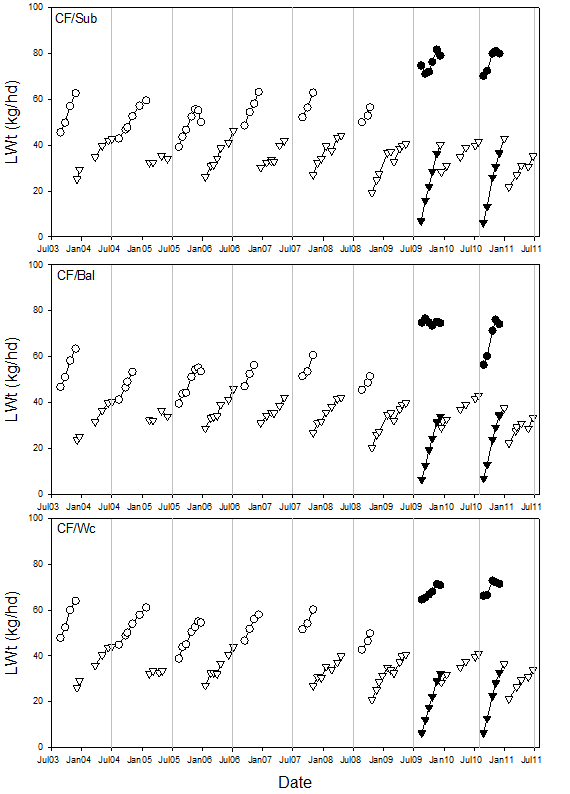
Figure 1 reports total and seasonal LWt production from Coopworth sheep which grazed the pastures.

Figure 2 shows accumulated total dry matter (TDM) production of the six pastures over the nine growth seasons, and total rainfall in each growth season – error bars are SEM for TDM. Most years lucerne yields were superior to all grass based pastures. Production from CF/Sub pastures was generally similar to or greater than all other grass-based pastures and yields from the annual Sub clover accounted for 25-32% of total annual yield in six of the nine years with yields of 2.4-3.8 t/ha Sub clover in those years.
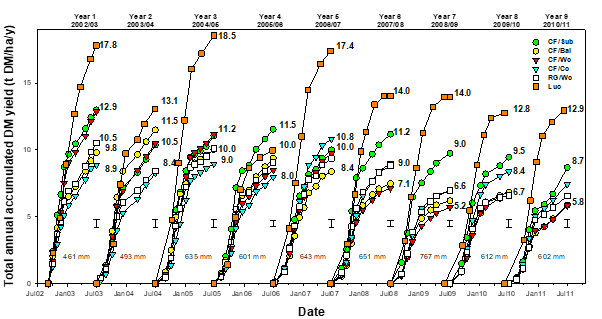
By the final year the sown grass and clovers accounted for about 65% of total yield in the cocksfoot based pastures compared with only 13% from the ryegrass and white clover in the control pasture. White clover content in the CF/Wc pasture was 25% in the first year and decreased to 3% in the last year.
Supplementary material associated with scientific publications
The following soil test data (Table 1) is supplementary material associated with the following publication: Mills A, Moot DJ, Lucas RJ. 2014a. ‘MaxClover’ Grazing Experiment: I. Annual yields, botanical composition and growth rates of six dryland pastures over nine years. Grass and Forage Science, 70, 557-570.
Table 1 Soil test results (0-75 mm) from the MaxClover Grazing Experiment at Lincoln University, Canterbury, New Zealand for nine growth seasons. Soil samples were analysed using Ministry of Agriculture and Fisheries Quicktest (MAF QT) procedures.
| pH | Olsen P | Ca2+ | Mg2+ | K+ | Na+ | SO4–S | ||
| Date | Pasture | (H2O) | (µg/ml) | meq/100 g | meq/100 g | meq/100 g | meq/100 g | (µg/ml) |
| 30/01/2002 | Pre-Sow | 5.7 | 14 | 5 | 16 | 6 | 7 | 3 |
| 11/06/2003 | CF/Sub | 5.9 | 14 | 7 | 15 | 9 | 7 | 12 |
| CF/Bal | 6.0 | 11 | 7 | 14 | 9 | 7 | 10 | |
| CF/Wc | 6.0 | 13 | 7 | 16 | 10 | 7 | 14 | |
| CF/Cc | 6.0 | 14 | 7 | 16 | 10 | 7 | 12 | |
| RG/Wc | 6.1 | 14 | 7 | 16 | 9 | 7 | 10 | |
| Luc | 5.8 | 13 | 7 | 16 | 10 | 6 | 17 | |
| 24/06/2004 | CF/Sub | 6.0 | 15 | 7 | 16 | 13 | 8 | 8 |
| CF/Bal | 6.0 | 12 | 6 | 15 | 10 | 9 | 11 | |
| CF/Wc | 6.2 | 13 | 7 | 16 | 11 | 8 | 7 | |
| CF/Cc | 6.2 | 13 | 7 | 18 | 9 | 8 | 8 | |
| RG/Wc | 6.2 | 11 | 8 | 16 | 10 | 8 | 11 | |
| Luc | 6.0 | 16 | 6 | 17 | 13 | 8 | 18 | |
| 28/04/2005 | CF/Sub | 6.2 | 15 | 7 | 14 | 13 | 9 | 6 |
| CF/Bal | 6.1 | 15 | 6 | 15 | 13 | 6 | 6 | |
| CF/Wc | 6.2 | 15 | 7 | 16 | 10 | 6 | 3 | |
| CF/Cc | 6.2 | 15 | 6 | 15 | 11 | 6 | 3 | |
| RG/Wc | 6.2 | 13 | 7 | 15 | 11 | 5 | 5 | |
| Luc | 6.0 | 18 | 6 | 14 | 15 | 6 | 9 | |
| 28/04/2006 | CF/Sub | 6.2 | 19 | 8 | 16 | 13 | 4 | 9 |
| CF/Bal | 6.2 | 18 | 7 | 16 | 13 | 9 | 12 | |
| CF/Wc | 6.2 | 20 | 6 | 16 | 12 | 9 | 14 | |
| CF/Cc | 6.2 | 23 | 7 | 17 | 13 | 9 | 13 | |
| RG/Wc | 6.2 | 15 | 7 | 16 | 9 | 9 | 11 | |
| Luc | 6.0 | 21 | 6 | 14 | 15 | 9 | 24 | |
| 26/07/2007 | CF/Sub | 6.4 | 22 | 9 | 17 | 19 | 7 | 3 |
| CF/Bal | 6.4 | 17 | 8 | 19 | 13 | 10 | 3 | |
| CF/Wc | 6.4 | 22 | 8 | 18 | 16 | 8 | 3 | |
| CF/Cc | 6.4 | 24 | 9 | 20 | 17 | 9 | 3 | |
| RG/Wc | 6.4 | 25 | 9 | 20 | 18 | 10 | 3 | |
| Luc | 6.5 | 27 | 9 | 22 | 17 | 10 | 3 | |
| 07/05/2008 | CF/Sub | 6.2 | 24 | 8 | 21 | 15 | 12 | 10 |
| CF/Bal | 6.4 | 24 | 8 | 20 | 15 | 9 | 7 | |
| CF/Wc | 6.3 | 20 | 8 | 20 | 15 | 10 | 7 | |
| CF/Cc | 6.3 | 22 | 8 | 21 | 15 | 11 | 7 | |
| RG/Wc | 6.3 | 18 | 8 | 20 | 12 | 12 | 11 | |
| Luc | 6.2 | 25 | 8 | 19 | 17 | 8 | 17 | |
| 12/05/2009 | CF/Sub | 6.3 | 18 | 8 | 21 | 15 | 7 | – |
| CF/Bal | 6.2 | 17 | 8 | 19 | 14 | 5 | – | |
| CF/Wc | 6.3 | 19 | 9 | 20 | 14 | 6 | – | |
| CF/Cc | 6.3 | 22 | 7 | 20 | 14 | 6 | – | |
| RG/Wc | 6.3 | 14 | 8 | 19 | 11 | 6 | – | |
| Luc | 6.3 | 19 | 8 | 18 | 17 | 4 | – | |
| 11/06/2010 | CF/Sub | 6.1 | 26 | 8 | 22 | 15 | 7 | 4 |
| CF/Bal | 6.1 | 25 | 8 | 20 | 14 | 4 | 3 | |
| CF/Wc | 6.2 | 26 | 8 | 20 | 13 | 5 | 3 | |
| CF/Cc | 6.1 | 26 | 8 | 21 | 14 | 5 | 3 | |
| RG/Wc | 6.1 | 20 | 7 | 18 | 10 | 5 | 4 | |
| Luc | 6.1 | 25 | 8 | 18 | 18 | 4 | 5 |
The following graze days and liveweight data is supplementary material associated with the following publication:
Mills A, Lucas RJ, Moot DJ. 2014b. ‘MaxClover’ Grazing Experiment. II. Sheep liveweight production from six grazed dryland pastures over eight years. New Zealand Journal of Agricultural Research, 58, 57-77.
Please see the publication for relevant information on the timing and class of stock grazing to aid interpretation. The difference between total grazing days (Table 2) and ‘Production’ grazing days (Table 3) represents grazing events associated with pasture management where sheep grazed at high stocking rates for short durations to clean up pastures. During these times liveweight gain was assumed to be zero.
Table 2 Total annual grazing days per hectare from “production” and “maintenance” stock classes grazing six dryland pastures at Lincoln University, Canterbury, New Zealand over nine growth seasons.
| Pasture | 02/03 | 03/04 | 04/05 | 05/06 | 06/07 | 07/08 | 08/09 | 09/10 | 10/11 |
| CF/Sub | 7321 | 5637 bc | 6727 abc | 7081 a | 8420 ab | 6804 ab | 5953 a | 7549 a | – |
| CF/Bal | 8742 | 6329 a | 8247 a | 6967 a | 9298 a | 6359 bc | 5184 bc | 6275 b | – |
| CF/Wc | 7862 | 5795 ab | 7706 ab | 6499 a | 8320 ab | 6659 ab | 5128 bc | 6516 b | – |
| CF/Cc | 7669 | 5419 bc | 6912 abc | 6744 a | 9198 a | 7193 a | 5488 ab | 7452 a | – |
| RG/Wc | 6854 | 5121 cd | 6344 bc | 5324 b | 8180 b | 5870 cd | 4670 c | 5904 b | – |
| Luc | 4684 | 4772 d | 5557 c | 4593 b | 6190 c | 5316 d | 5317 b | 5990 b | – |
| Mean | 5512 | 6916 | 6201 | 8286 | 6367 | 5290 | 6614 | ||
| SEM | 198.8 | 544.8 | 256.7 | 340.3 | 226.9 | 208.2 | 265.0 | ||
| Significance | *** | * | *** | *** | *** | ** | *** |
Table 3 ‘Production’ graze days/ha for sheep grazing the ‘MaxClover’ grazing experiment at Lincoln University, Canterbury, New Zealand. ‘Production’ graze days were not recorded in 2002/03 (Year 1). In spring of 2009/10 (Year 8) and 2010/11 (Year 9) grazing days were for ewes with twin lambs at foot in spring.
| Pasture | 02/03 | 03/04 | 04/05 | 05/06 | 06/07 | 07/08 | 08/09 | 09/10 | 10/11 |
| CF/Sub | – | 5119 ab | 6309 | 6026 a | 5647 | 5425 a | 5692 | 6657 a | 6652 a |
| CF/Bal | – | 4075 c | 5621 | 6114 a | 4833 | 5130 abc | 4924 | 5333 bc | 5206 b |
| CF/Wc | – | 5282 a | 6824 | 5702 a | 5527 | 5275 ab | 4829 | 5506 bc | 5146 b |
| CF/Cc | – | 4932 ab | 6214 | 6034 a | 5926 | 5512 a | 4829 | 6096 b | 5493 b |
| RG/Wc | – | 4865 ab | 5629 | 4579 b | 4975 | 4561 c | 4561 | 5012 c | 4360 c |
| Luc | – | 4772 b | 5089 | 3785 c | 5271 | 4768 bc | 5120 | 5643 bc | 5263 b |
| Mean | 4841 | 5948 | 5373 | 5383 | 5112 | 5051 | 5666 | 5353 | |
| SEM | 159.3 | 453.6 | 221.7 | 287.4 | 201.9 | 286.3 | 247.0 | 234.8 | |
| Significance | ** | ns | *** | ns | * | ns | ** | *** |
Table 4 Fractional distribution of grazing days on six dryland pastures at Lincoln University, Canterbury, New Zealand over nine growth seasons.
| Year | ||||||||||
| Season | Pasture | 02/03 | 03/04 | 04/05 | 05/06 | 06/07 | 07/08 | 08/09 | 09/10 | 10/11 |
| Spring | CF/Sub | – | 0.56 bc | 0.77 | 0.71 ab | 0.68 a | 0.66 a | 0.74 a | 0.85 | 0.67 a |
| CF/Bal | – | 0.74 a | 0.53 | 0.69 b | 0.52 b | 0.67 a | 0.65 b | 0.76 | 0.64 a | |
| CF/Wc | – | 0.57 bc | 0.64 | 0.66 b | 0.70 | 0.72 a | 0.67 b | 0.75 | 0.68 a | |
| CF/Cc | – | 0.56 bc | 0.58 | 0.66 b | 0.72 a | 0.67 a | 0.64 bc | 0.75 | 0.68 a | |
| RG/Wc | – | 0.60 b | 0.68 | 0.76 a | 0.69 a | 0.67 a | 0.70 ab | 0.79 | 0.69 a | |
| Luc | – | 0.52 c | 0.62 | 0.57 c | 0.47 b | 0.48 b | 0.58 c | 0.74 | 0.54 b | |
| Mean | 0.59 | 0.64 | 0.67 | 0.63 | 0.64 | 0.66 | 0.77 | 0.64 | ||
| SEM | 0.21 | 0.72 | 0.21 | 0.27 | 0.30 | 0.022 | 0.026 | 0.022 | ||
| Significance | *** | ns | *** | *** | *** | *** | ns | *** | ||
| Summer | CF/Sub | – | 0.28 ab | 0.28 | 0.12 cd | 0.27 b | 0.17 bc | 0.10 c | 0.08 b | 0.10 c |
| CF/Bal | – | 0.00 e | 0.56 | 0.12 c | 0.40 a | 0.19 b | 0.17 b | 0.18 a | 0.17 b | |
| CF/Wc | – | 0.24 bc | 0.29 | 0.18 b | 0.29 b | 0.09 c | 0.16 b | 0.19 a | 0.18 b | |
| CF/Cc | – | 0.33 a | 0.35 | 0.16 bc | 0.25 b | 0.15 bc | 0.17 b | 0.18 a | 0.14 bc | |
| RG/Wc | – | 0.22 c | 0.27 | 0.06 d | 0.29 b | 0.16 bc | 0.10 c | 0.16 a | 0.18 b | |
| Luc | – | 0.09 d | 0.36 | 0.33 a | 0.44 a | 0.35 a | 0.29 a | 0.18 a | 0.33 a | |
| Mean | 0.19 | 0.35 | 0.16 | 0.32 | 0.18 | 0.17 | 0.16 | 0.19 | ||
| SEM | 0.18 | ns | 0.20 | 0.30 | 0.032 | 0.015 | 0.025 | 0.016 | ||
| Significance | *** | 0.076 | *** | *** | *** | *** | * | *** | ||
| Autumn | CF/Sub | – | 0.16 c | 0.06 c | 0.17 ab | 0.05 ab | 0.17 | 0.16 ab | 0.07 ab | 0.23 a |
| CF/Bal | – | 0.26 b | -0.09 d | 0.20 a | 0.08 a | 0.14 | 0.18 a | 0.06 bc | 0.19 ab | |
| CF/Wc | – | 0.19 c | 0.07 a | 0.15 b | 0.01 c | 0.20 | 0.18 a | 0.07 ab | 0.17 bc | |
| CF/Cc | – | 0.12 d | 0.07 a | 0.18 a | 0.03 bc | 0.18 | 0.19 a | 0.07 ab | 0.18 b | |
| RG/Wc | – | 0.18 c | 0.05 a | 0.18 ab | 0.03 bc | 0.17 | 0.20 a | 0.05 c | 0.13 d | |
| Luc | – | 0.39 a | 0.01 b | 0.11 c | 0.08 a | 0.17 | 0.13 b | 0.08 a | 0.13 cd | |
| Mean | 0.22 | 0.005 | 0.18 | 0.05 | 0.17 | 0.17 | 0.07 | 0.17 | ||
| SEM | 0.010 | 0.010 | 0.011 | 0.011 | 0.022 | 0.015 | 0.006 | 0.015 | ||
| Significance | *** | *** | *** | *** | ns | * | * | *** |

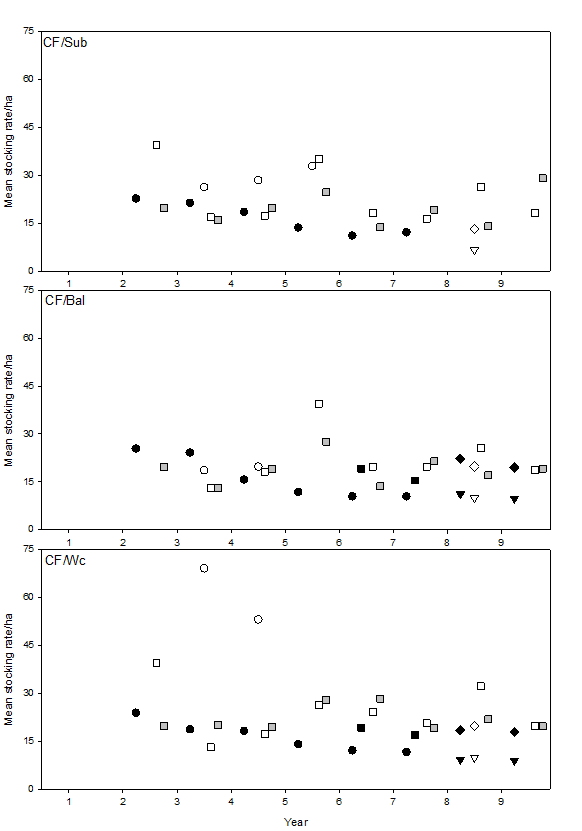
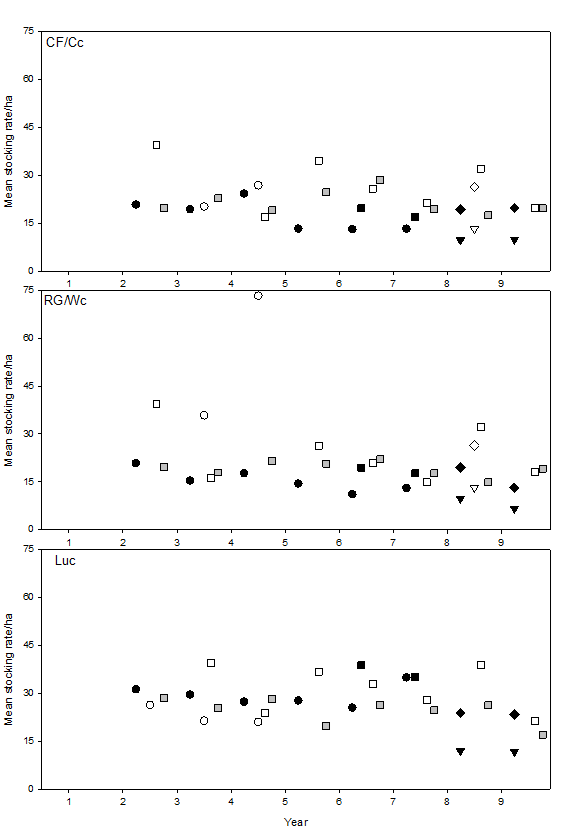
Average stocking rates
A ‘put and take’ system matched feed supply to animal demand. the graph below shows the average stocking rates for different seaons and stock classes grazing the pastures.
Researchers
- Derrick Moot, Head of Dryland Pastures Research
- Dick Lucas, Senior Lecturer (retired)
- Malcolm Smith, Research Technician
Students
- Clayton Buckley (B.Ag.Sci Honours)
- Janelle Sangster-Ward (B.Ag.Sci Honours)
- Annamaria Mills (PhD)
- Nop Tonmukayakul (M.Ag.Sci.)
- Nicole Morris (M.Ag.Sci.)
- Dave Monks (PhD)
- Serkan Ates (PhD)
Publications
- Mills A, Moot DJ, Lucas RJ. 2014a. ‘MaxClover’ Grazing Experiment: I. Annual yields, botanical composition and growth rates of six dryland pastures over nine years. Grass and Forage Science, 70, 557-570.
- Mills A, Lucas RJ, Moot DJ. 2014b. ‘MaxClover’ Grazing Experiment. II. Sheep liveweight production from six grazed dryland pastures over eight years. New Zealand Journal of Agricultural Research, 58, 57-77.
- Morris NJ. 2011. Productivity, botanical composition and insect population of seven dryland pasture species in Canterbury after eight years. M.Ag.Sci. thesis, Lincoln University, Lincoln. 93 p.
- Morris NJ, Smith MC, Mills A, McNeill MR, Moot DJ. 2016. Insect populations of six dryland pastures grown in Canterbury. Journal of New Zealand Grasslands 78: 109-116.
- Monks DP. 2009. The vegetative and reproductive development of balansa clover. PhD thesis, Lincoln University, Canterbury. 164 p.
- Monks DP, Moot DJ, Smith MC, Lucas RJ. 2008. Grazing management for regeneration of balansa clover in a cocksfoot pasture. Proceedings of the New Zealand Grassland Association 70: 233-238.
- Tonmukaykul N. 2009. Water use efficiency of six dryland pastures in Canterbury. M.Ag.Sc. thesis, Lincoln University, Lincoln. 73 p.
- Tonmukaykul N, Moot DJ, Mills A. 2009. Spring water use efficiency of six dryland pastures in Canterbury. Agronomy New Zealand 39: 81-94.
Downloads
| 09/07/2014. The MaxClover Photo Diary. Dry matter yield and botanical composition of the ‘MaxClover’ Grazing experiment at Lincoln University, Canterbury, New Zealand. 2002/03 to 2010/11. 117 p. (PDF 44.2 MB). |  |
| 24 Jan 2012. Dryland Pasture Research: A field day booklet for visitors to the MaxClover Grazing Experiment. 18 p. (PDF 1.5 MB) | |
| 17 Dec 2015. Nori H, Monks DP, Moot DJ. 2015. A reproductive development scale for arrowleaf, balansa, gland and Persian clovers. (PDF 3.2 MB). | |
| 15 Nov 2010. Mills A, Moot DJ. 2010. Annual dry matter, metabolisable energy and nitrogen yields of six dryland pastures six and seven years after establishment. NZGA Conference presentation. (PDF 0.2 MB). | |